Tokyo 2021
Using SKLearn Gaussian Naive Bayes Model
About
A n event that originated in ancient Greece as many as 3000 years ago, The Olympics, have now taken the world by storm. Athletes endure countless hours of intense physical training over the course of four years or more, yet there seems to be trends among medal winners. In this exercise we will try to predict the medal distribution for the Tokyo Olympic winners based on historical Olympic data. We will be implementing Gaussian Naive Bayes (Gaussian) using sklearn, to determine the outcome for the following sports: tennis, swimming, and rhythmic gymnastics.
Abstract: We will be implementing the Gaussian statistical model in python to determine the 2021 Olympic Medal distribution by country for: tennis, swimming, and rhythmic gymnastics.
Data Set
W
e will be using the open-source data site “Kaggle” and use the data set for 120 years of Olympic history: athletes and results. This data set was constructed by author "Rgriffin” using scrape and wrangle on the site www.sports-reference.com in May 2018. The file contains ~ 270K entries and 15 attributes. Each row corresponds to one athlete in one event. The attributes are as follows:
1. ID - Unique number for each athlete
2. Name - Athlete's name
3. Sex – Male or female
4. Age – - Athlete's age at time of competition
5. Height – Height of athlete in centimeters
6. Weight – Weight of athlete in kilograms
7. Team – Olympic Team name (Country)
8. NOC - National Olympic Committee 3-letter code
9. Games - Year and season in which the games took place
10. Year – Year in which the games took place
11. Season - Summer or Winter for the Olympics
12. City - Host city of Olympics
13. Sport – Sport athlete is competing in
14. Event – Event athlete is competing in
15. Medal - Gold, Silver, Bronze, or NA for each athlete
For the analysis we will focus on tennis, swimming, and rhythmic gymnastics and the following rows: Name, Age, Sex, Height, Weight, NOC, Games
Data Preparation
To prepare the data we will:
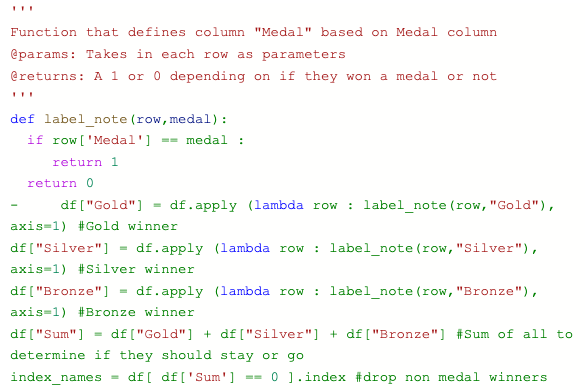
- Drop unnecessary fields and filter the data down to 3 sports
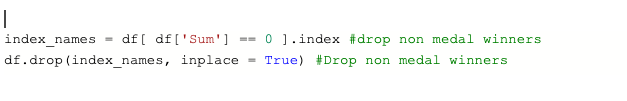
 - Drop athletes that did not win medals using a lambda call
 - Drop unnecessary fields and filter the data down to 3 sports
Data Extraction
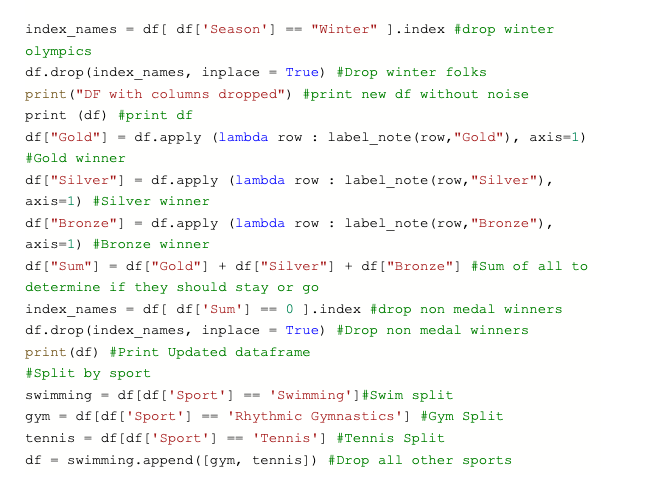
- We will load the data into a panda’s data frame and we will extract three data frames
a. Tennis
b. Swimming
c. Gymnastics
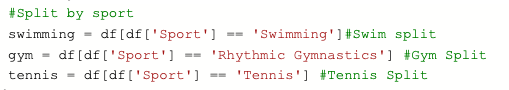 - We drop all other sports:
 - We will only be analyzing athletes that won medals, meaning from now on all items in the data frame are those who won either: gold, silver, or bronze medals.
Analysis
B Before we run the prediction algorithm it is important to understand the data distribution based on age, weight, height, gender, sport, and country.
Age Distribution
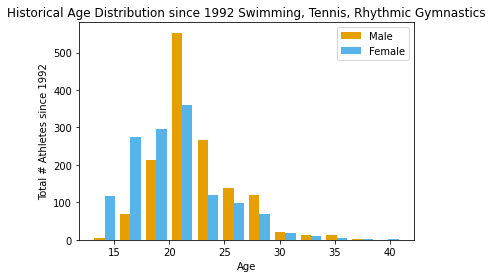
Here we can see that most athletes are in their early 20’s. At age 15, the number of female athletes overtakes the number of male athletes by more than 3 times. On the other spectrum around age 23 male athletes overtake the number of female athletes across all three sports.
Weight Distribution
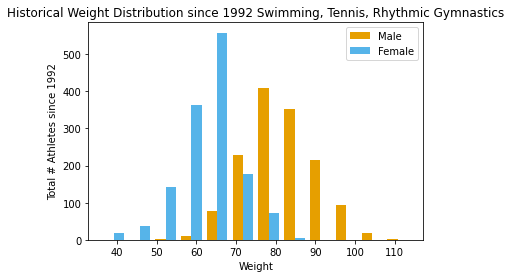
Unlike age, we see that weight is split with female athletes being on the lower end of the spectrum and male athletes being on the upper end of the spectrum. Interestingly enough the one place where the weight distribution is the closest is at 70 kg.
Stats by Sport
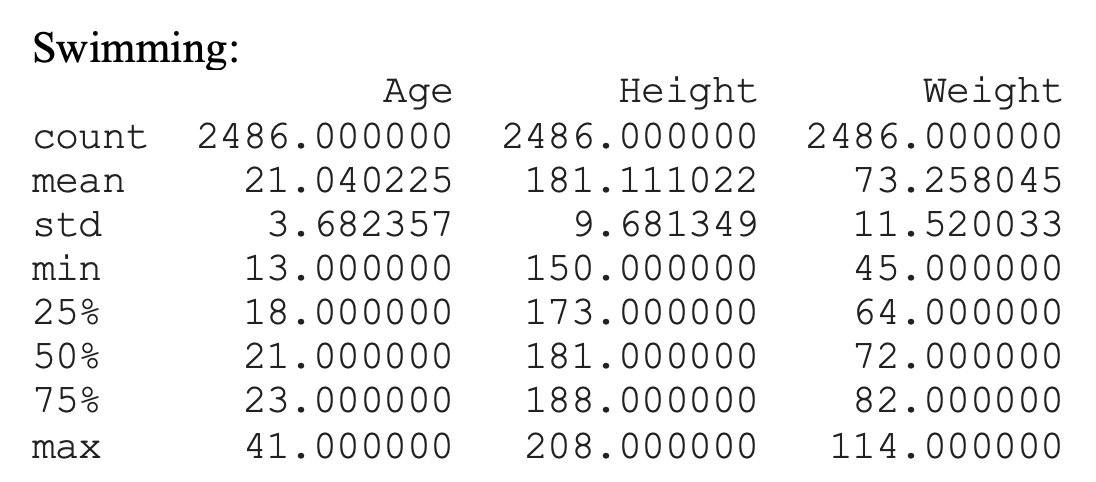
In the data set above we see that most athletes that compete in swimming events have a mean age of 21, with the minimum age of 13*, and a maximum age of 41. The minimum line item of 13, that we see here, most likely occurred before the rule was implemented. The height of the athletes has an average of 181 centimeters with a minimum of 150 centimeters in a maximum of 208 centimeters . Lastly the weight has a mean of 73Kgs with a minimum of 45Kgs and a maximum of 100 and 114Kg * This line item shows us a very important historical event, in 1982 the Olympic Committee created a rule in which athletes were required to turn at least 15 years of age in the calendar year to compete in senior level events.
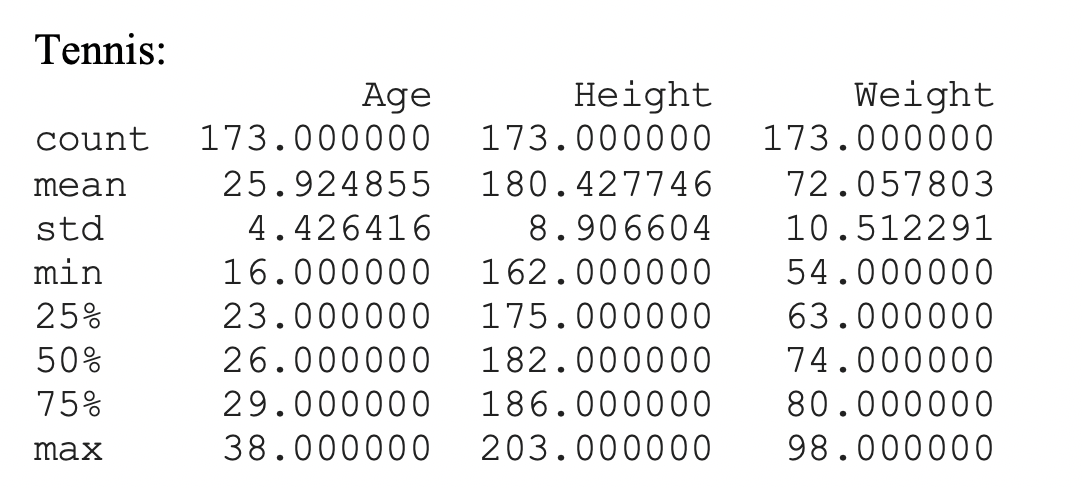
In tennis the average age is 26 with a minimum age of 16 and a maximum age of 38 . The height is on average 180 centimeters, with a minimum of 162 centimeters, and a maximum of 203 centimeters . The weight is an average 72 kilograms, with a min of 54 kilograms, and a max of 98 kilograms.
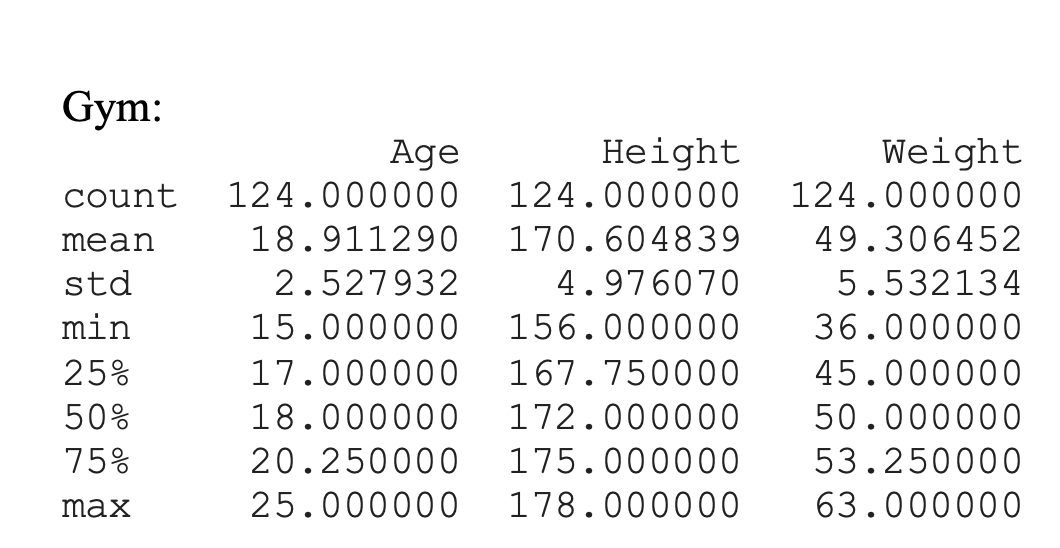
For rhythmic gymnastics we have an average age of 18 years old with a minimum of 15 and a maximum of 25. The height is on average 170 centimeters, with the min of 156 centimeters, and a maximum of 178 centimeters . The weight has a mean of 49 kilograms, with a min of 36 kilograms, and a max of 63 kilograms.
Stats Analysis
When we compare all three sports’ statistical charts we determined the following : Tennis has the oldest mean age at 25 while gymnastics has the lowest at 15. Gymnasts also tend to be on the lower end of the weight spectrum but have a similar height to the rest of their peers. The sport in which athletes are the tallest is swimming very closely followed by tennis ( 1 point difference) .
Top Medalists Analysis
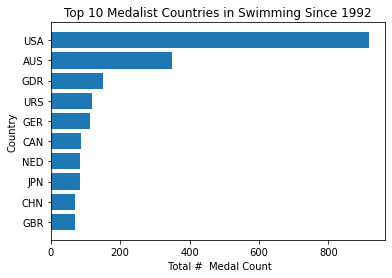
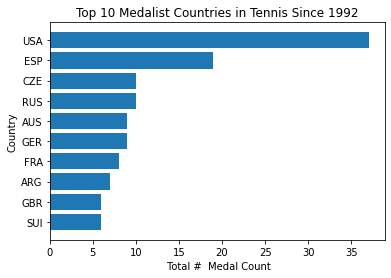
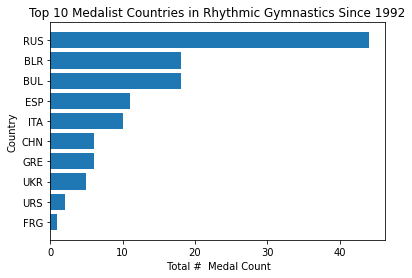
In these three charts we see the top ten countries that have gained the most medals in 120 years. The United states seems to have twice as many medals as the rest of the countries for both tennis and swimming . On the other hand , Russia seems to have as twice as many medals for rhythmic gymnastics. It is in this category in which we also see smaller countries winning more medals, such as Belarus.
W
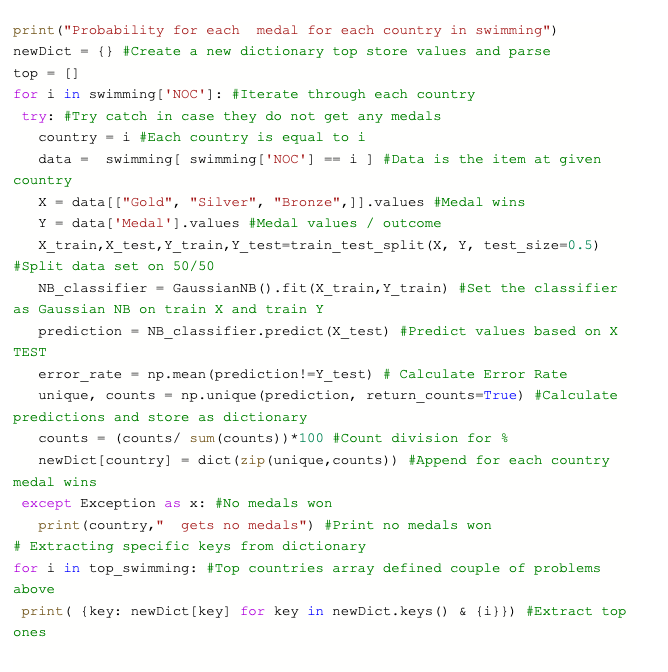
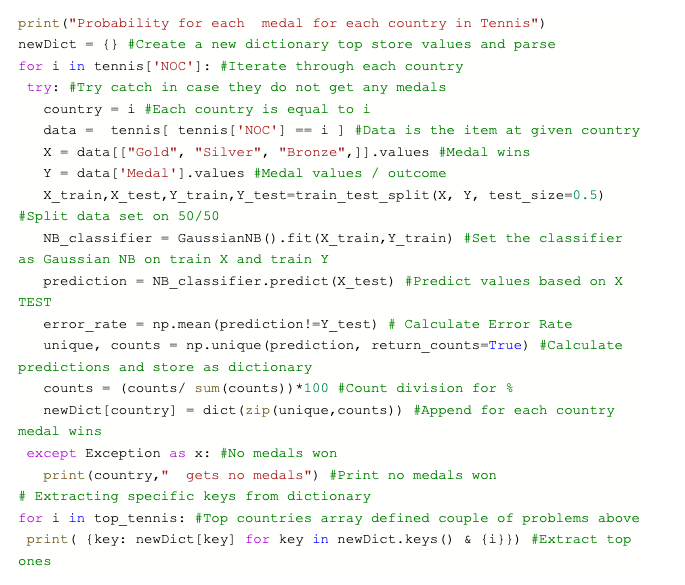
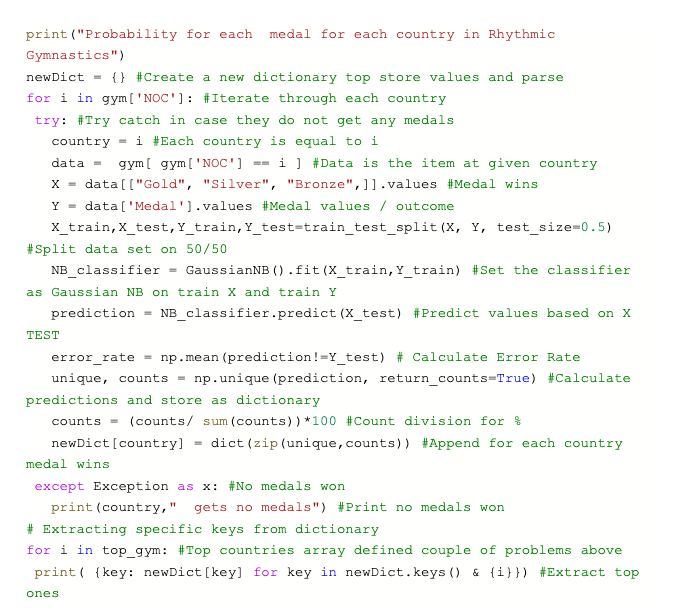
We will now run our naive bayes model to predict the probability a top country will win a specific medal. We divide the classifier into test and training datasets by doing a 50/50 data split. We use Gaussian NB as the classifier and fit on X train. We then calculate the predictions using x test and extract the values and counts . the counts are the total number of medals each country is expected to win, however, since we do not know which countries will win we will predict the distribution of medals if they win. To do this we divide the total number of predicted metals by gold ,silver, and bronze wins. this returns a percentage that we then multiply by 100.
We run this model for each country and wrap it around a try except loop. in case a country doesn't win any medals. after predicting all countries, we will extract the top ten countries that have won the most medals from the data sets in the blue bar charts and predict them as the winners. As a reminder our data set only contains countries that have won any kind of medal in the past therefore there is the possibility that some countries may not win any medals
A
fter running GaussianNB we obtain the probability that a given country will win a medal (if any).
For swimming Kazakhstan, Trinidad and Tobago ,Serbia, Switzerland ,Croatia, Greece ,Slovakia, Lithuania, Singapore, and Venezuela will not win any medals.
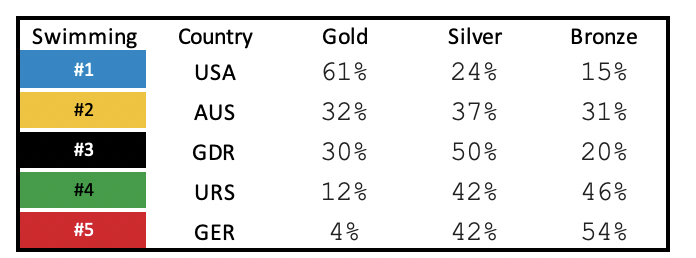
For swimming the countries that are predicted to win the most gold medals are the US, Australia, and Germany. The United states has a 61% chance of winning a gold medal, while Australia has a 32% chance, and Germany a 30% chance.* Germany is predicted to have the most silver and bronze medals at 50 % and 54% respectively.
* Initially the data set split East Germany in Germany into two different sections giving East Germany a 30% chance of winning a gold medal in Germany giving a 4% chance of winning a gold medal. We chose the highest probability.
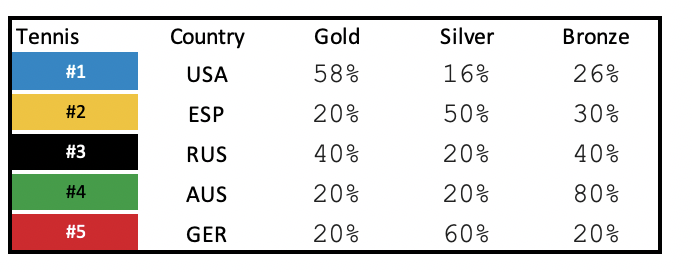
For tennis Serbia, Bulgaria, Puerto Rico and India will not win any medals. Australasia no longer exists and will not win any medals.
For tennis the country that is predicted to win the most gold medals is the United states followed by Russia. with a 58% chance for the United states in a 40% chance for Russia. The countries that are predicted to win the most silver medals are Germany followed by Spain with a 60% chance and 50 % chance respectively. The country that is predicted to win the most bronze medals is Australia with an 80% chance.
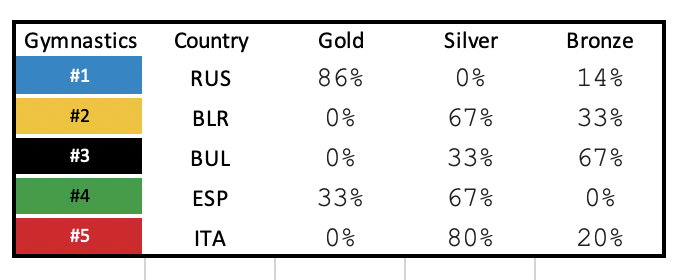
Canada and Romania will not win medals, neither will the Unified Team since this was a temporary country when the Soviet Union had a revolution in 1991. Similarly, FRG also known as the Federal Republic of Germany no longer exists and will not win any medals.
For rhythmic gymnastics the country that is predicted to win the most gold medals is Russia followed by Spain. Russia has an 80% chance that most of their medals will be gold and Spain has a chance that 33% of their medals will be gold. Belarus, Bulgaria, and Italy are predicted to be silver. With Italy having the highest chance of winning the silver medal with an 80% chance. For bronze the country that is most likely to win the medals is Bulgaria with a 67% chance .
To recap we split our data set into only medal winners for the Summer Olympics for three sports: swimming, rhythmic gymnastics, and tennis. For each of those splits we performed a 50/ 50 data split to predict the outcome of each of the countries. Throughout the exercise we encounter certain issues that the machine learning algorithm of naive bayes wouldn't have been aware of. The most obvious one was countries that no longer exist or have dissolved. This shows us the limitations of machine learning algorithms and why it is important to have a background on our data before we run any sort of prediction. If we were to rerun this exercise I would extract a list for each of the countries codes and remove historical ones that are no longer in use and remove outliers . Overall, I would say that naive bayes is a very quick and efficient algorithm to determine probabilities. However, it has its limitations such as assuming all predictors are independent and in sports this is rarely the case, we also use Gaussian NB which is very sensitive to outliers and affects the mean. It was very interesting to see the diversity of age, weight, and height in different athletes since there is a theory that athletes are getting fitter and stronger for their sport by having coaches select desired characteristics. For example, a shorter gymnast is favored over a taller gymnast since ,in theory, they are more able to do turns and flips. I highly recommend watching this Ted talk from David Epstein which goes more into detail about this theory:
HERE
This was a fun thought provoking exercise however it should not be taken too seriously as the estimations could be wrong in some cases. I am excited to see the outcomes of the Olympics and see how well this prediction ran.
Naive Bayes
Results
Conclusion