M[eat]
H ow much meat is too much meat? Some may say there is no such thing while others say that any consumption of meat is too much. While many may debate these opinions, it is important to see the effect that the mass production of meat is having on the environment and our health. Meat is a great source of protein, B12, and Iron [1], however; in excess it can have detrimental effects on our society. High cholesterol [2], antibiotic resistance [4], and greenhouse gases [5] are just a few of the consequences the livestock industry is having in our planet. If we don’t act now the effects of it may be irreversible. [5]
In this analysis, we will explore the environmental consequences of the mass production of animal farming and what we can to create a more sustainable ecosystem. By diving this analysis into three parts: production, consumption, and effects.
Production
A nimal farming has been around since the "Neolithic Revolution" around 10,000 years ago, but may have begun much earlier [3]. Most of these farmers had a handful of domesticated animals that they would trade for goods or use for consumption. The Industrial Revolution in the late 19th century introduced the concept of factory farming forever changing the way we eat [3].
World Meat Production
Starting in the 1960’s we
see a spike in meat
production which is then followed by an
exorbitant growth in the 90's. [6]
If we look at the late 2000’s
we see that we globally we produce about
342
Continent Meat Production
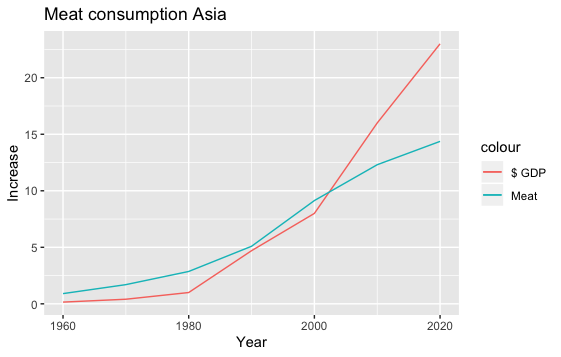
When we divide the data by continent [6], we see that the biggest consumer of meat today is Asia, they overtake the rest of the world by almost 2X as much production. The underlying factor is East Asia. Surprisingly, on the other hand, the smallest consumer of meat is Australia and Africa, their production of meat has remained steady since the 60's. In Europe we see a spike in meat production followed by a dip in 1995 which remains steady to 2020. There has been research done which concluded that meat production rises as a country gets richer [8]. This theory proves to be correct when we compare the GDP of East Asia and their meat production, we 1995 was the turn point for both of these variables.[9]
GDP and Meat Production
Consumption
H ow much meat per capita does the we consume in a year? When we look at the amount of meat (red and poultry) consumed in the United states from 1960 to 2020.[10] On average the per capita amount is 201 lbs. per person in a year with a standard deviation of 12 lbs. When we draw various samples of the data [10], we obtain different results and our results are not accurate. For example, when we draw 3 simple random samples, we see that the data seems to be going up, however; when we draw 50 + samples using simple random selection without replacement we see that the chart is not constant. This is due to the fact that meat consumption is not a constant spike and extracting samples from different years skews the data and provides an erroneous conclusion. From my observations some journals will extract data from various sets and provide only a small set of information ;they then declare them as facts [11]. Therefore, it is always important to look at the growing trends holistically rather than in a micro scale.
Sample Data Extraction
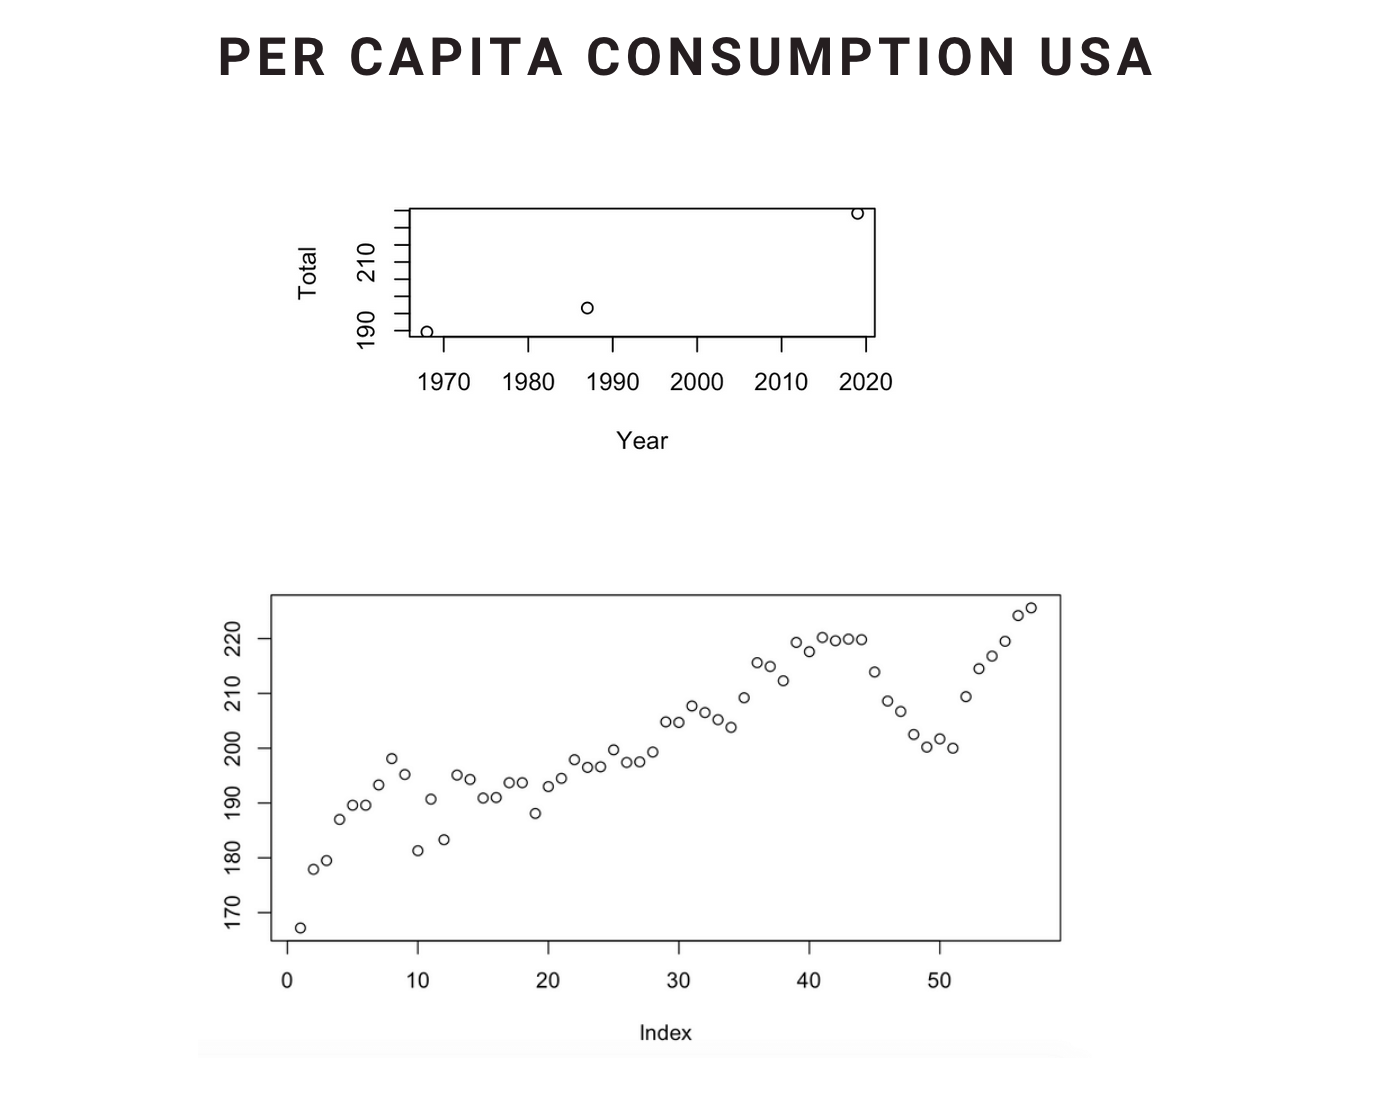
Per Capita Consumption in the USA in a year
Consumption in the USA has its ups and downs, the slope is not constant, but on average Americans consume 200lbs of meat every year. That is 16 lbs. per month or half a pound a day. To have more context one burger is around .25 lbs., this means that the average American is consuming two quarter lbs. burgers per day every single day. But does this apply to all those who live in the US?
Standard deviation chart world
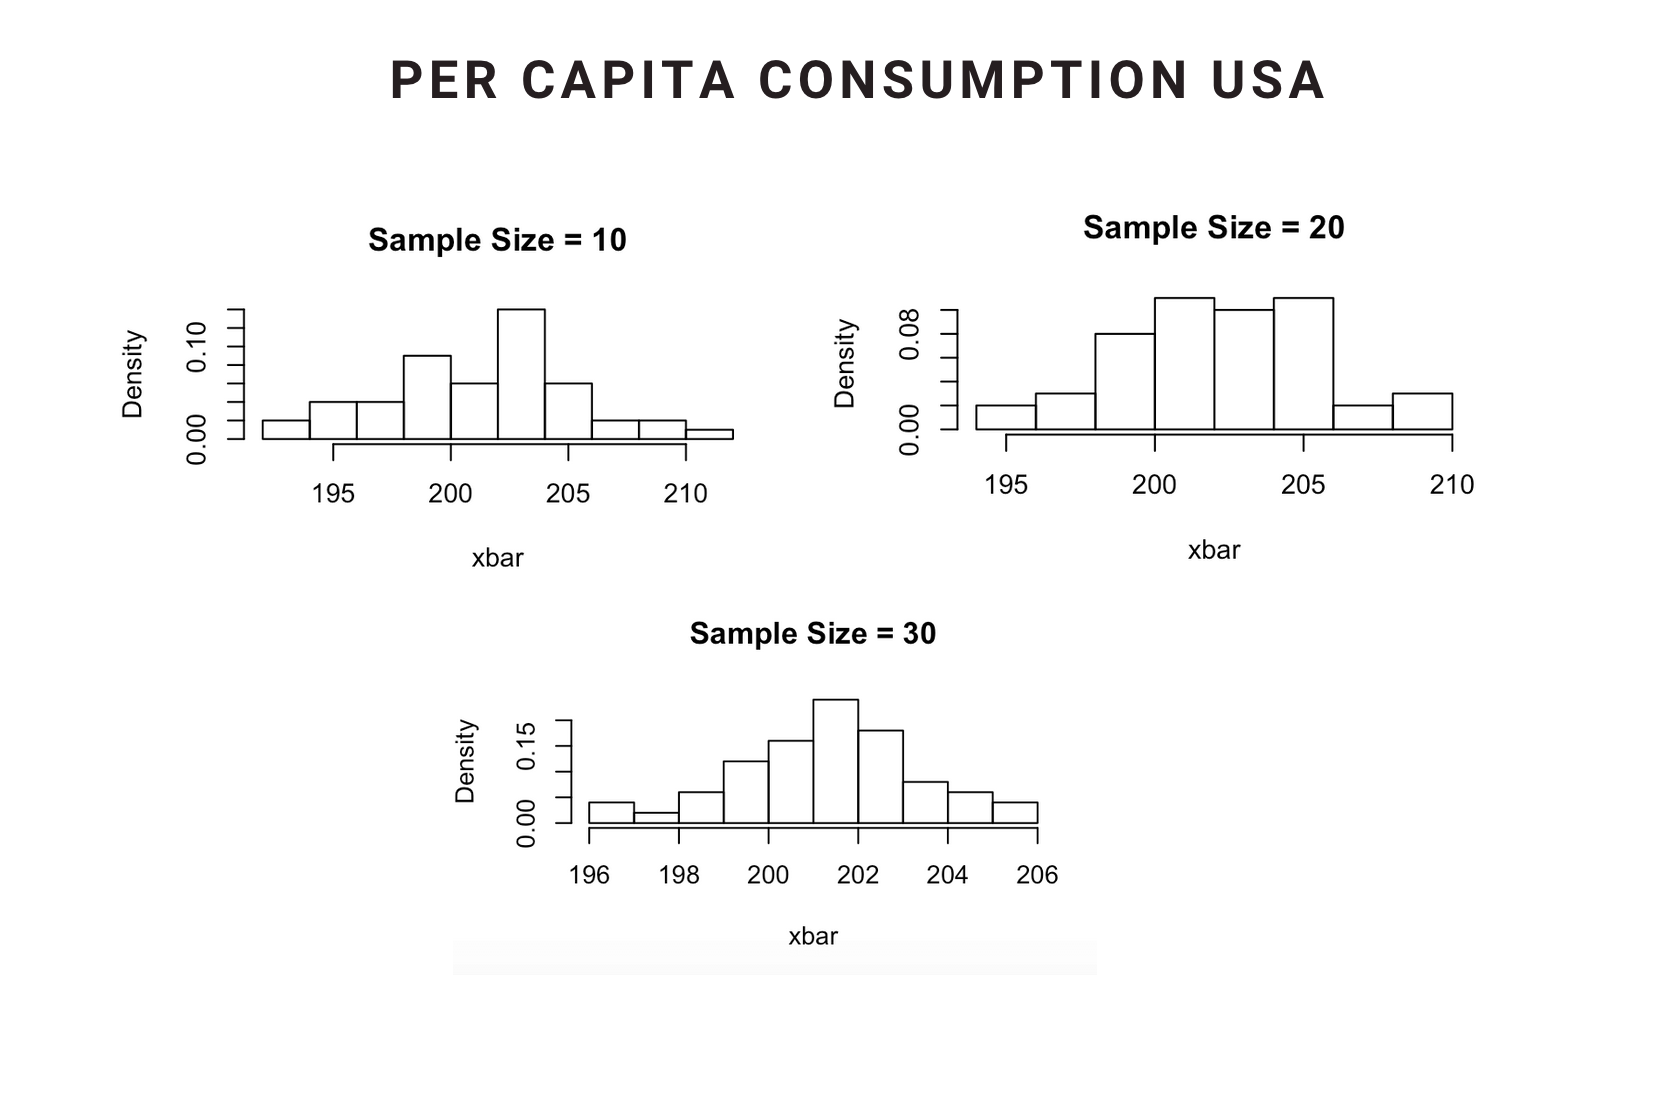
The central limit theorem states that if you have a population with mean μ(MU) and standard deviation σ (sigma) and take sufficiently large random samples from the population with replacement, then the distribution of the sample means will be approximately normally distributed. In this case we see that CLT applies to the charts since the more samples we extract the more uniform the sampling distribution for per capita meat consumption becomes. In this chart we start to see a normal distribution for the average American consuming around 200 lbs. per meat each year. Meaning yes, most Americans are in fact coursing around two burgers per day every day.
Antibiotics + Greenhouse Gasses
E very action as a group we take has a considerable result in our environment. In the previous section we observed the insatiable desire for meat the world is craving, now we will analyze two environmental livestock byproducts.
Antibiotic Use in Cattle
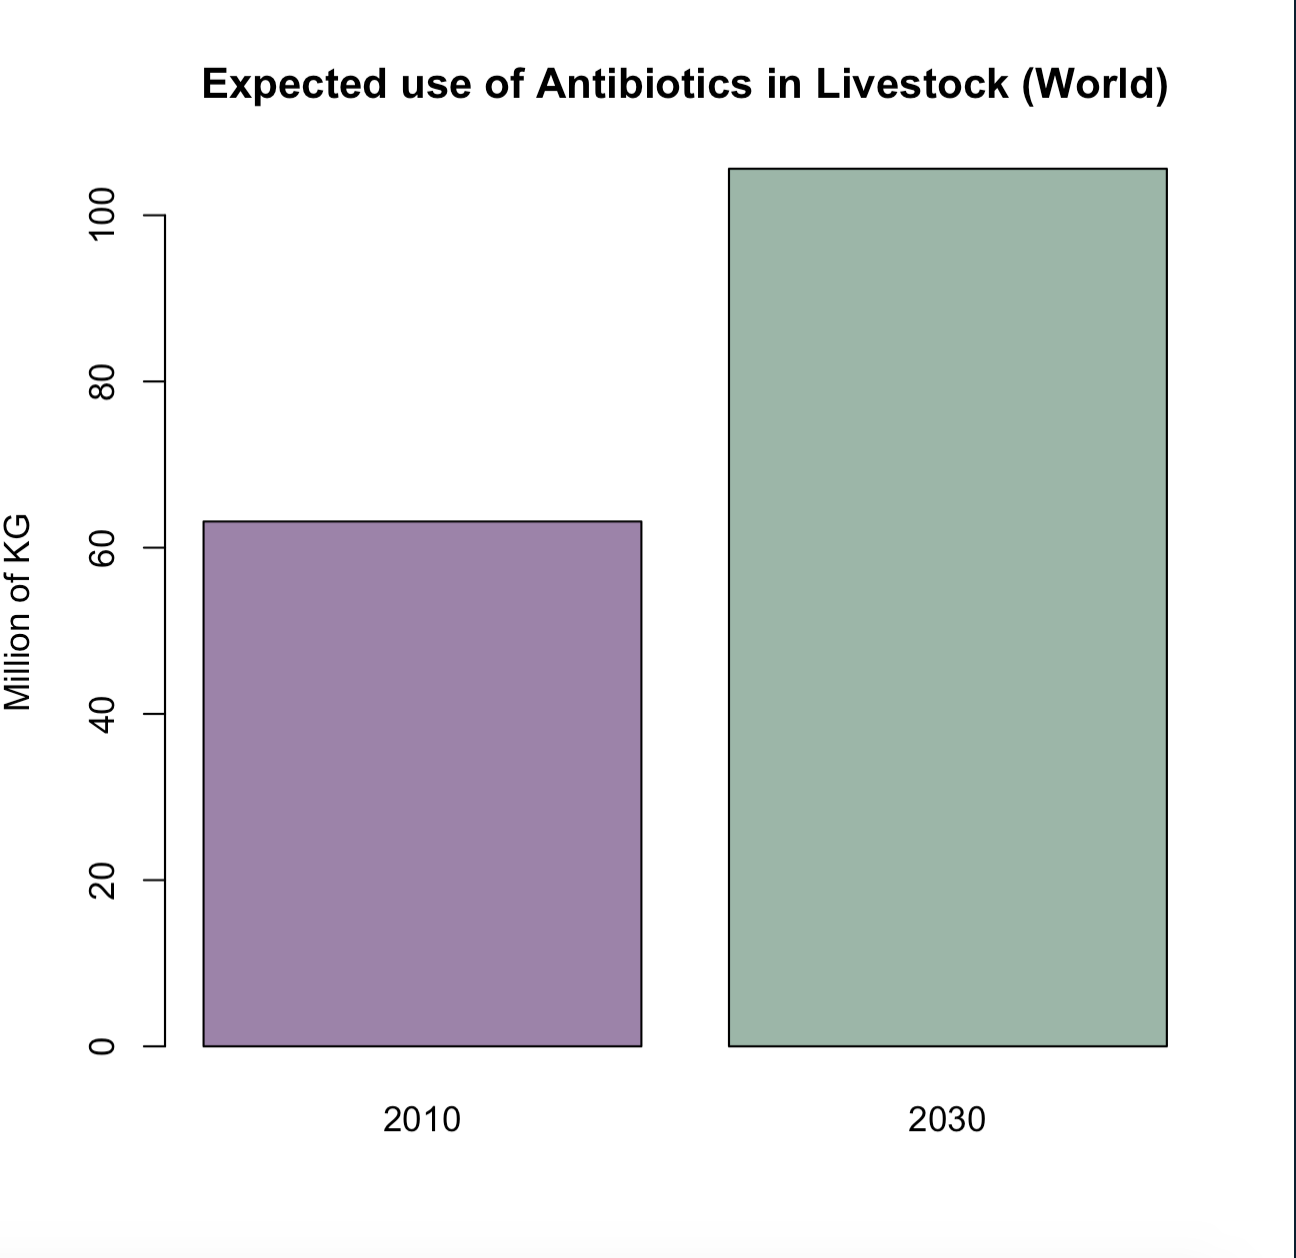
According to the CDC “Antibiotic resistance is one of the greatest public health challenges of our time—few treatment options exist for people infected with antibiotic-resistant bacteria.” [12] Antibiotics given to livestock today surpasses 20 million pounds in the US alone, [13] this is 80% of all antibiotics sold in the US [14]. this means that those who consume these animals are also consuming a dose of those antibiotics. This has become such a concern that the FDA Announced an Implementation of GFI / Continuing Efforts to Address Antimicrobial Resistance. [15] However, there have been bills introduced since 1999 attempting to phase out the non-therapeutic use of eight classes of medically important antibiotics and restrict the use of many other antibiotics in animal feed. [15] That was more than 21 years ago and the bills have never made it out of committee. The National Center for Biotechnology Information predicts that this number will rise by 67% by 2030. "This rise is likely to be driven by the growth in consumer demand for livestock products in middle-income countries and a shift to large-scale farms where antimicrobials are used routinely." NCBI [16] So which countries will consume the most?
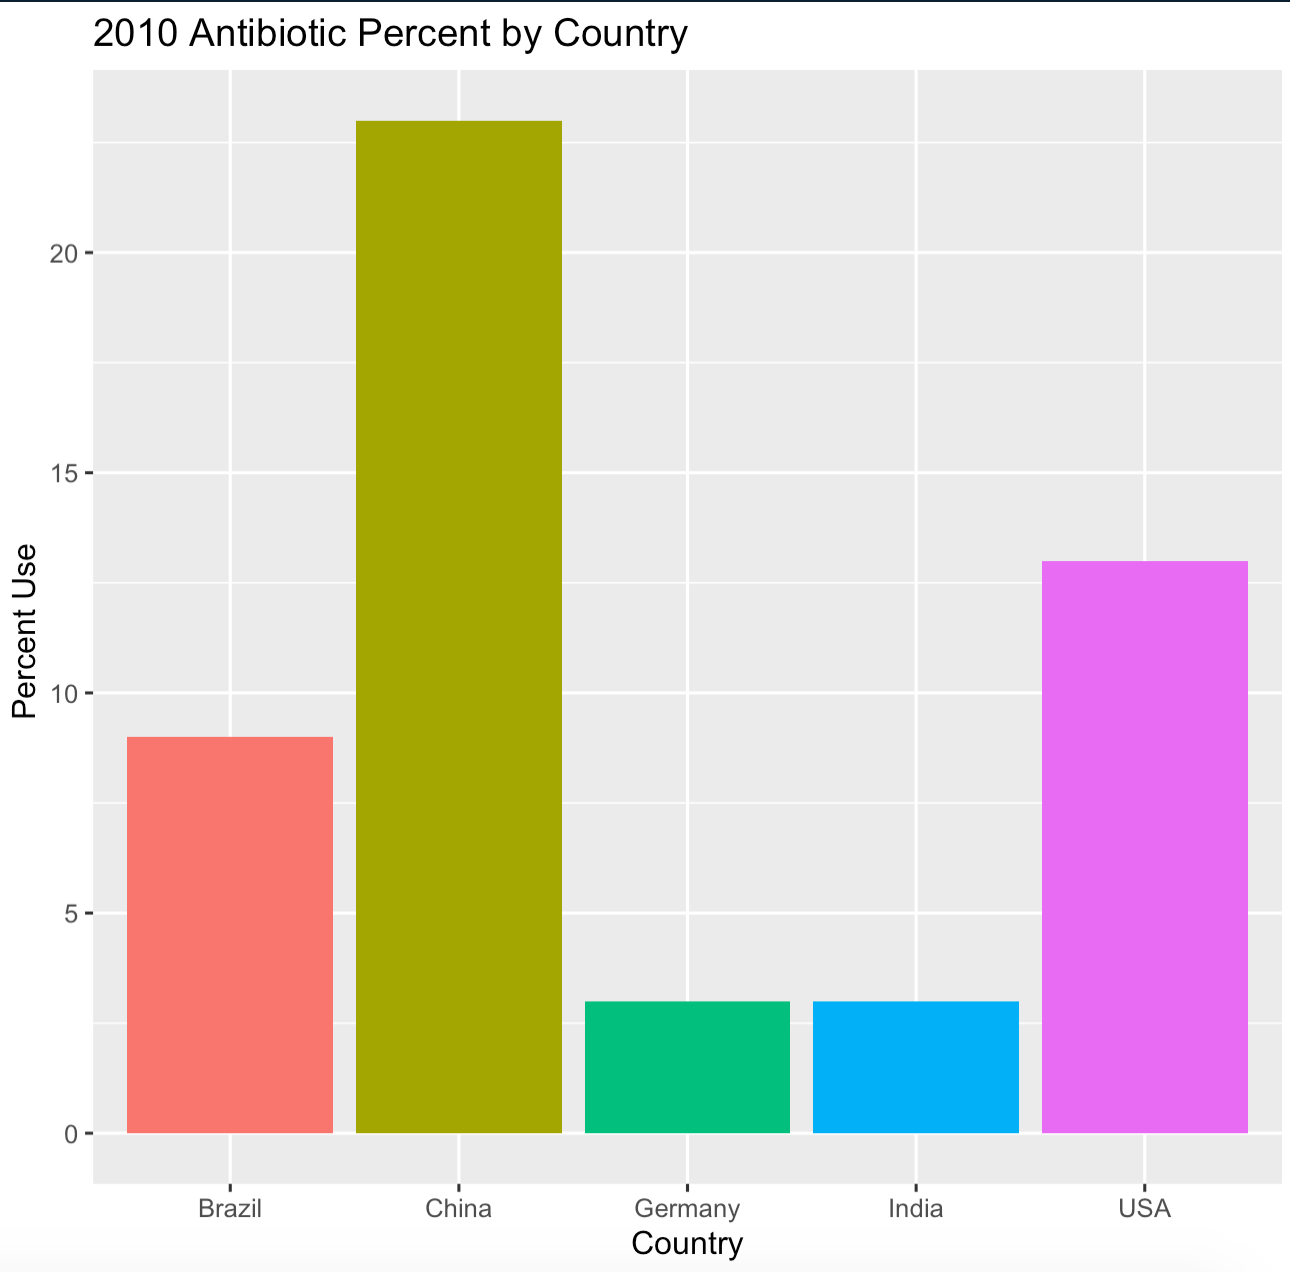
The top 5 countries that use the most antibiotics are China, USA, Brazil, Germany, and India. with a mean of 10.2%, with a standard deviation of 8. China surpasses the United States by almost twice as much (23% China v 13% USA) and both of them surpass Germany (3%) and India (3%) by more than 4 times. This means that five countries in the world account for more than 50% each year. Quantile Analysis: Min - 3, 1st Q - 3, Median - 9, Mean - 10.2, 3rd Q - 13, Max 23
Greenhouse Gasses
As the population of the world rises so does out carbon footprint increases and greenhouse gases skyrocket. Worldwide, livestock accounts for between 14.5 percent and 18 percent of human-induced greenhouse gas emissions [17]. The most important greenhouse gases from animal agriculture are methane and nitrous oxide. [18] Methane, mainly produced by enteric fermentation and manure storage, is a gas which has an effect on global warming 28 times higher than carbon dioxide.[18]
Greenhouse effects by product
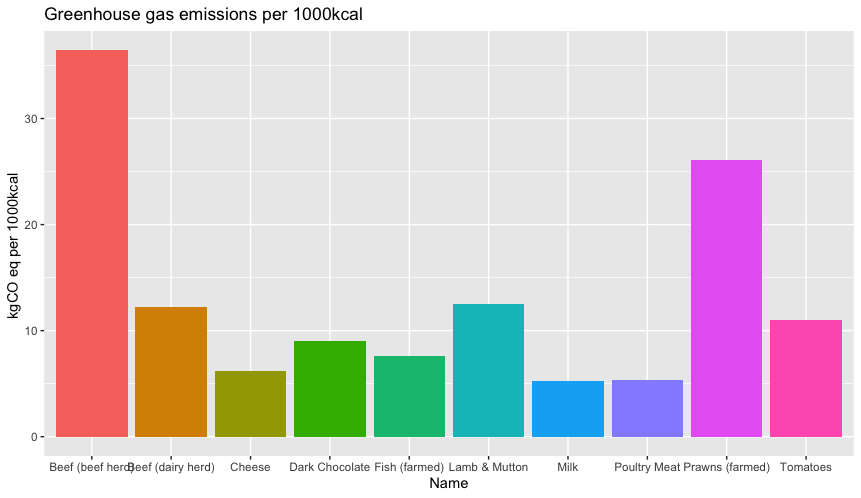
When we look at the greenhouse gases by products, we see that beef
is the leading product.
The mean is 13.16 kg, with a SD of 10.19.
When we divide the data, we see the following results of where the data is broken
down:
Summary:
Min. 1st Qu. Median Mean 3rd Qu. Max.
5.250 6.532 10.012 13.165 12.447 36.440
Quantiles:
0% 25% 50% 75% 100%
5.250000 6.531538 10.011605 12.446927 .
This is of great importance when you take into account
the kinds of gases that are being released and the tremendous amount each of them hold.
In 30 years, we see that the data will grow by more than double and this presents a massive challenge for our planet.
What do we do next?
C hoices decide what future we will have and those choices come from how well informed we are. If we continue to consume meat at the scale, we have our world will no longer be able to sustain itself. Not only are we hosting 7.6 billion humans in the planet but also around 9 billion animals for livestock. How can we contribute to do so in 30-50 years if the growth for both of these variables has been massive? The harmonious balance between species has been decreasing while the farming of animals has increased. Antibiotic use has been on the rise and it is out of control and the greenhouse emissions caused by livestock alone are creating irreversible consequences for our planet. We need to reduce and restrict the amount of meat produced each year this will slow down the environmental impacts of livestock in our lives.
Appendix
Data Sets
Preparing the data
All the data sets with the exception of Antibiotic Use in the World and Meat Consumption in the USA were downloaded from their corresponding websites. Then exported as CSV’s and imported into R using the Read CSV command which the creates a data frame and the data can be extracted as desired. The other two files (Antibiotic Use in the World and Meat Consumption in the USA) had to be extracted from their websites by hand due to the lack of a csv download option. For Antibiotic use the article and summary was read and the numbers they provided were placed into a data frame directly onto R. On the other hand, Meat Consumption in the USA, had to be copy pasted into an excel file since the data given was a table in html, the file was then converted into a csv and imported into R. The chart for GDP per capita was found from Google Scholar open source and was embedded as an HTML. All the data sets have been placed into a folder that can be downloaded below.
References
Nutrition Facts of meat by Nutrition Facts [1]
Red Meat Consumption & Risk of Heart Failure by NCBI [2]
History of Meat by Meat Science [3]
Antibiotic Resistance by CDC [4]
Environmental Impact of Meat by Time Magazine [5]
Livestock Data by FAO [6]
Livestock Production by NCBI [7]
Livestock Production by The Economist [8]
GDP Asia by World bank [9]
Meat Consumption Per Capita by USDA [10]
Health Risks of Meat by NY Times [11]
Antibiotic Resistance by CDC [12]
Antibiotic Use in Livestock by The SAGE Encyclopedia[13]
Antibiotic Resistance by Sciencemag [14]
FDA Proposals by The FDA [15]
Antimicrobial Use in Animals by NCBI [16]
Global Warming and Livestock by NY Times [17]
Livestock and Climate Change by Oxford Academic [18]
Antibiotics Bill by the House of Representatives [19]
Works Cited
Works Cited
Albala, Ken. The SAGE Encyclopedia of Food Issues. Los Angeles, Sage Reference, 2015.
Antibiotic Resistance. 2019, www.cdc.gov/narms/faq.html.
ANTIBIOTIC RESISTANCE AND THE USE OF ANTIBIOTICS IN ANIMAL AGRICULTURE. 1999.
“Are Antibiotics Turning Livestock into Superbug Factories?” Science | AAAS, 8 Dec. 2017, www.sciencemag.org/news/2017/09/are-antibiotics-turning-livestock-superbug-factories.
Ashaye, A., et al. “Red Meat Consumption and Risk of Heart Failure in Male Physicians.” Nutrition, Metabolism and Cardiovascular Diseases, vol. 21, no. 12, Dec. 2011, pp. 941–946, 10.1016/j.numecd.2010.03.009. Accessed 5 June 2019.
Carroll, Aaron E. “Meat’s Bad for You! No, It’s Not! How Experts See Different Things in the Data.” The New York Times, 1 Oct. 2019, www.nytimes.com/2019/10/01/upshot/health-risks-meat-experts.html. Accessed 28 Feb. 2020.
CDC. “Antibiotic Resistance Questions and Answers.” Centers for Disease Control and Prevention, 29 May 2018, www.cdc.gov/antibiotic-use/community/about/antibiotic-resistance-faqs.html.
Center for Veterinary Medicine. “CVM Guidance for Industry #213.” U.S. Food and Drug Administration, 2019, www.fda.gov/regulatory-information/search-fda-guidance-documents/cvm-gfi-213-new-animal-drugs-and-new-animal-drug-combination-products-administered-or-medicated-feed.
Accessed 15 Dec. 2019.
“FAO.” Fao.Org, 2020, www.fao.org/faostat/. Accessed 28 Feb. 2020.
Friedman, Lisa, et al. “The Meat Question, by the Numbers.” The New York Times, 25 Jan. 2018, www.nytimes.com/2018/01/25/climate/cows-global-warming.html.
“GDP per Capita (Current US$) - East Asia & Pacific, South Asia, Europe & Central Asia | Data.” Data.Worldbank.Org, data.worldbank.org/indicator/NY.GDP.PCAP.CD?locations=Z4-8S-Z7. Accessed 28 Feb. 2020.
“Global Meat-Eating Is on the Rise, Bringing Surprising Benefits.” The Economist, 4 May 2019, www.economist.com/international/2019/05/04/global-meat-eating-is-on-the-rise-bringing-surprising-benefits.
Grossi, Giampiero, et al. “Livestock and Climate Change: Impact of Livestock on Climate and Mitigation Strategies.” Animal Frontiers, vol. 9, no. 1, 12 Nov. 2018, pp. 69–76, academic.oup.com/af/article/9/1/69/5173494, 10.1093/af/vfy034.
“History of Meat Science.” Meatscience.Org, 2019, meatscience.org/about-amsa/history-mission/history-of-meat-science.
“Meat and Nutrition: The Latest Research | NutritionFacts.Org.” Nutritionfacts.Org, nutritionfacts.org/topics/meat/.
“Per Capita Consumption of Poultry and Livestock, 1965 to Estimated 2019, in Pounds.” The National Chicken Council, 2019, www.nationalchickencouncil.org/about-the-industry/statistics/per-capita-consumption-of-poultry-and-livestock-1965-to-estimated-2012-in-pounds/.
Van Boeckel, Thomas P., et al. “Global Trends in Antimicrobial Use in Food Animals.” Proceedings of the National Academy of Sciences, vol. 112, no. 18, 19 Mar. 2015, pp. 5649–5654, www.pnas.org/content/112/18/5649.short, 10.1073/pnas.1503141112.
Walsh, Bryan. “The Triple Whopper Environmental Impact of Global Meat Production | TIME.Com.” TIME.Com, Science & Space, 2012, science.time.com/2013/12/16/the-triple-whopper-environmental-impact-of-global-meat-production/.